Community Survey Results
Core Community Perceptions
A community survey was conducted to collect information and emotional sentiment related to local tourism, attractions and assets, community values and perceptions, and industry goals. The data collected helped the research and planning team identify the region’s differentiators and refine the recommended go-to-market strategy outlined in this plan. The survey included approximately 60 questions but the use of display logic meant some participants received additional follow-on questions in specific areas which made the total survey question count variable by participant. Lancaster City residents reported deep pride in the city and researchers noted that the local Net Promoter Scores (NPS) were the highest they had ever collected indicating a strong sense of local pride and a high local quality of life. Survey participants also expressed a clear and consistent vision for their community’s identity, repeatedly describing the city in terms of its cultural richness, historical relevance, and forward-leaning ethos.
Themes:
- Diverse and Multicultural: Residents take particular pride in Lancaster City’s status as one of America’s most diverse cities per capita
- Independent and Creative: Residents, nonprofit leaders, and businesses all put strong emphasis on supporting local independent entrepreneurs and linked this need to the ability to maintain the city’s unique character
- Artistic and Welcoming: There was strong and consistent recognition of both the formal arts scene (inclusive of performing arts) and the creative spirit that permeates daily life
- Safe, Friendly, and Walkable: Despite some noted concerns about the general perception of safety, residents consistently described a safe, friendly, and welcoming community that they consistently said they feel comfortable exploring on foot day or night
- Historic and Beautiful: Participants showed deep appreciation for the way the community blends and balances its charming architectural heritage with contemporary vibrancy
Residents also expressed desire for some changes:
- They felt largely left out of the county’s tourism program: Residents reported feeling the county’s narrative strategy was mostly about the “Amish,” “rural farmland” and “buffets” and didn’t adequately cover what their culturally diverse urban setting had to offer
- They wanted to see the city invest in citycentric marketing: 90% of survey participants felt increased tourism and visitation was good for the city. Many felt the city had lots of unique assets and attractions to offer, that the city’s unique urban environment was worthy of dedicated promotion, and that marketing needed to try to attract a “different type of traveler”
- They desired increased attention on History and Heritage: Residents reported they were proud of the city’s diverse history and unique heritage and the many ways it connects with the larger American story. They consistently expressed that they hoped this plan would help elevate these stories and connection points
- They wanted a heavier focus on promoting the Arts: Participants were proud of the local arts scene but several expressed that treasured places like Gallery Row were losing their identity over time and that performing arts venues were at risk if their high value offerings weren’t promoted more heavily
- More Culinary Storytelling: Residents were incredibly proud of the local food scene. They felt the local story extends well beyond the celebrated local markets and includes fresh and prepared local food that has evolved from a variety of global traditions.
Community Survey: Regional Resident Outlook
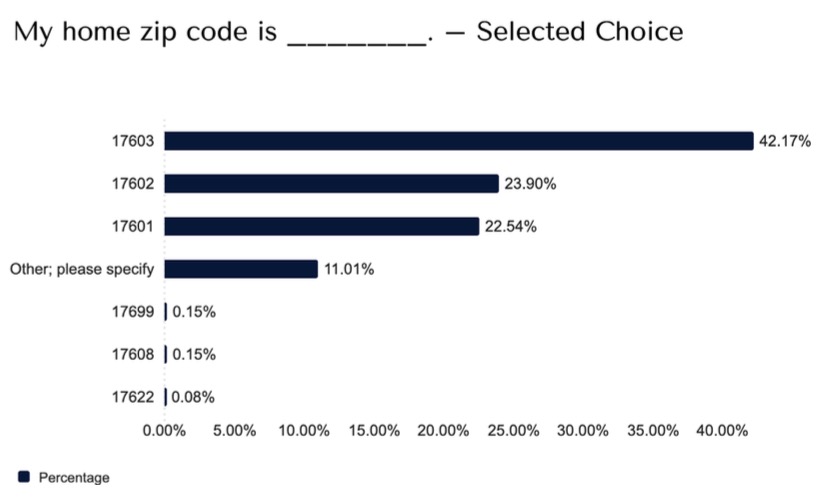
Community Survey – ZIP Codes
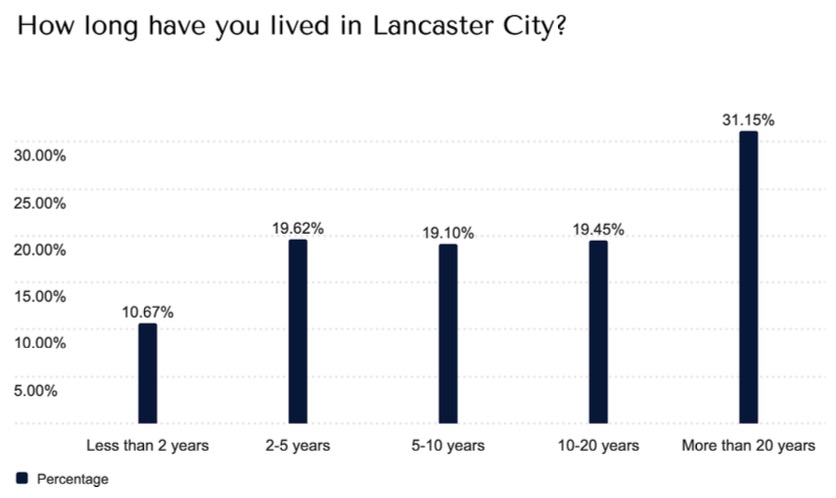
Community Survey – How long have you lived in Lancaster City?
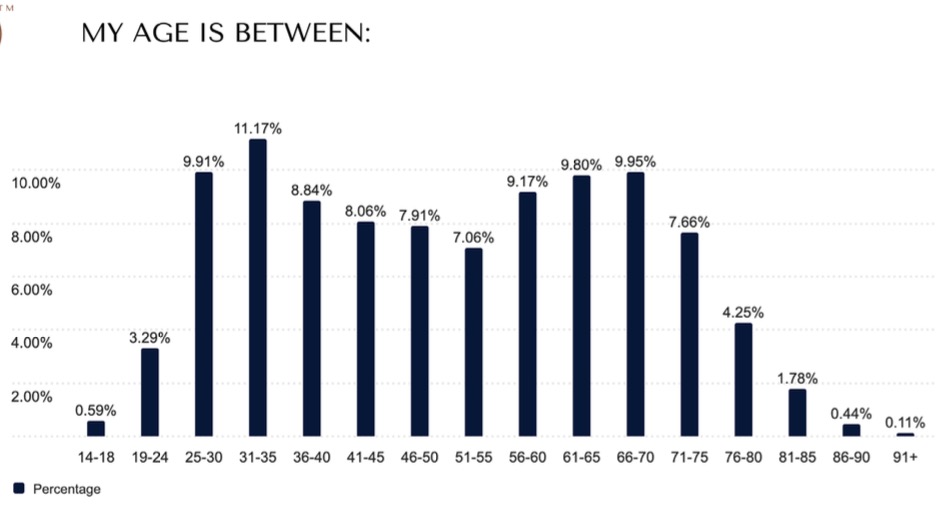
Community Survey – Age Range
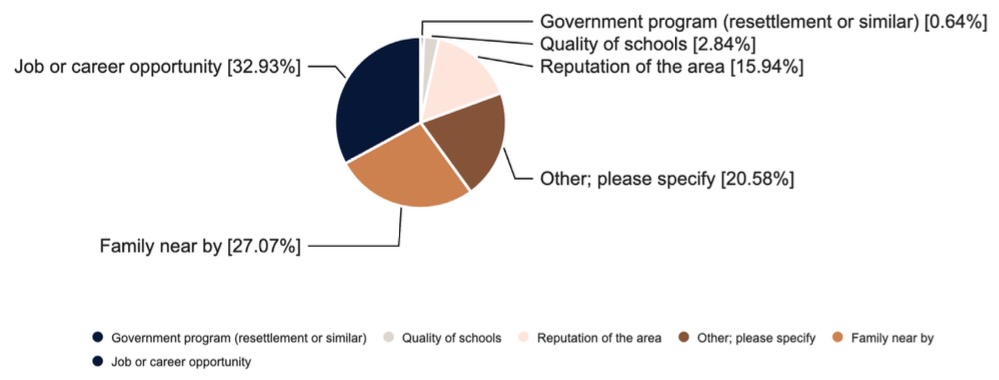
Community Survey – Why did you move here?
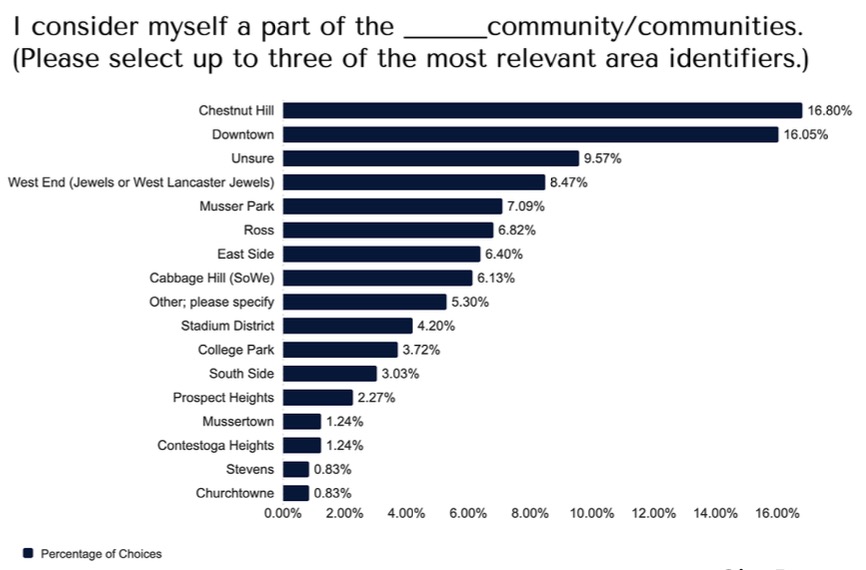
Community Survey – Community Selection
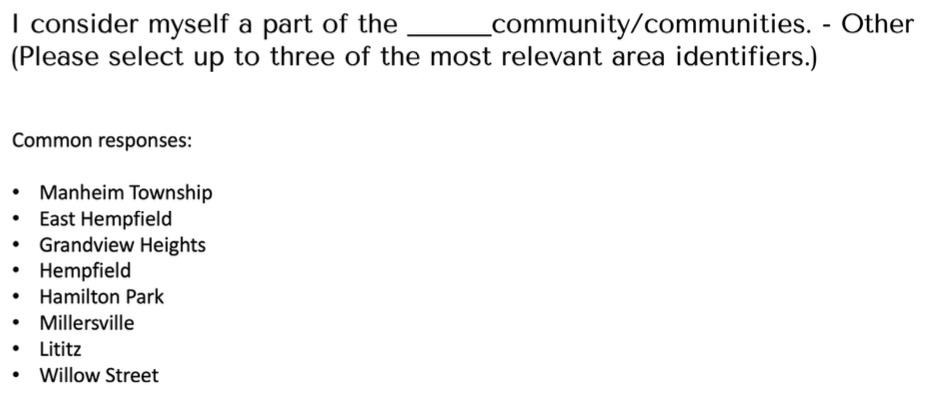
Community Survey – Community Selection (“Other” Options)
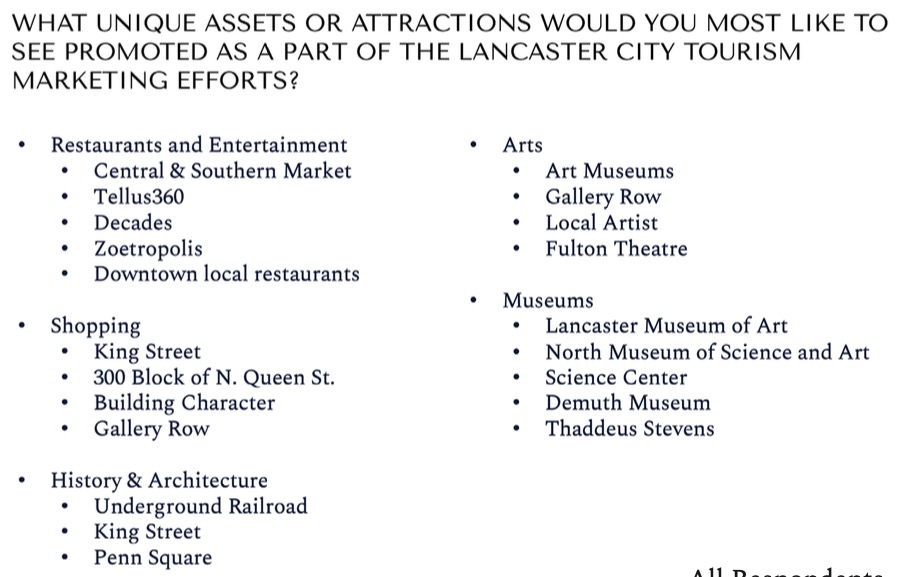
Community Survey – Unique Assets
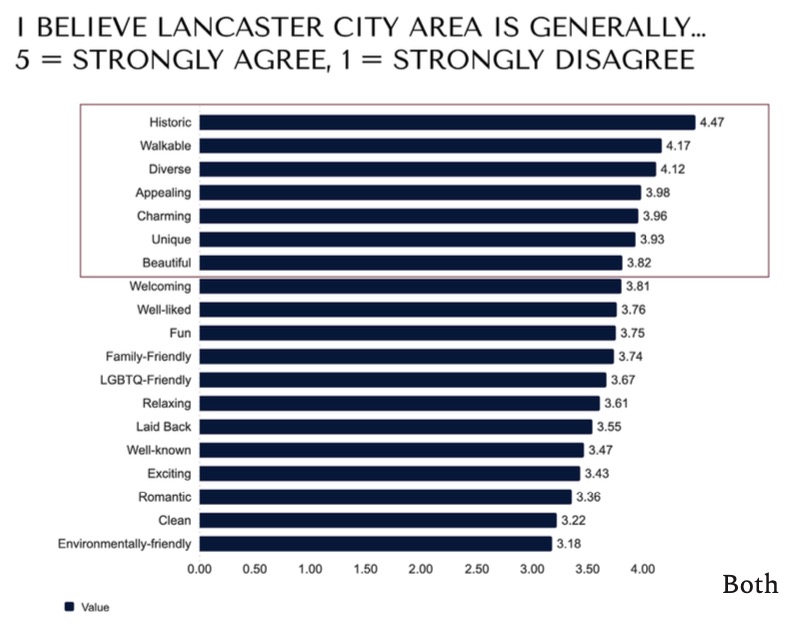
Community Survey – Community Sentiment
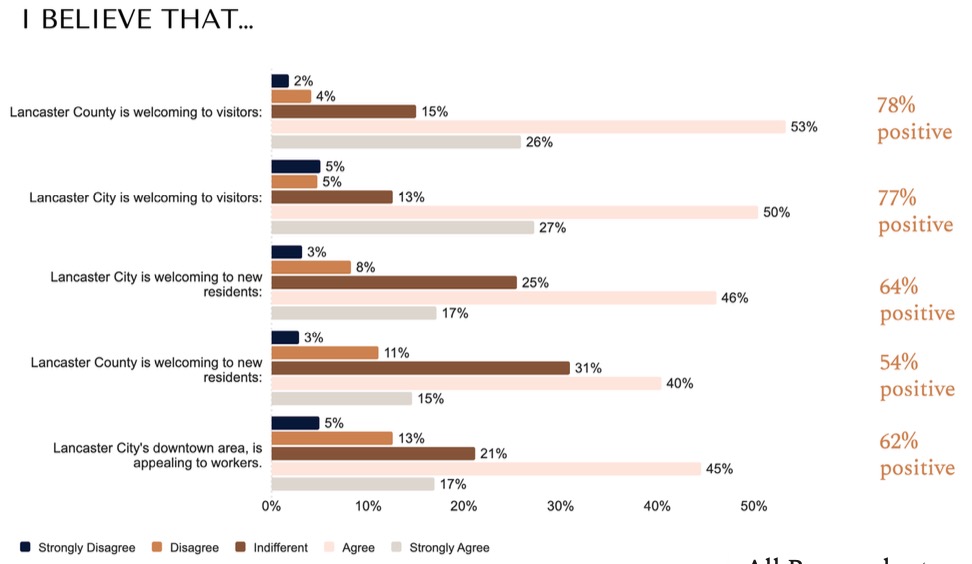
Community Survey – Community Sentiment
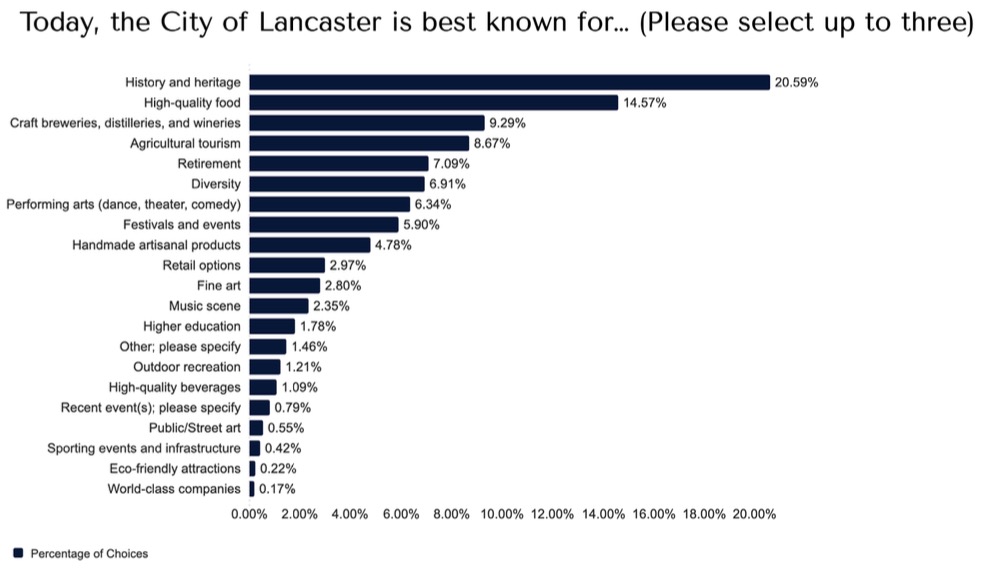
Community Survey – Lancaster City is best known for…
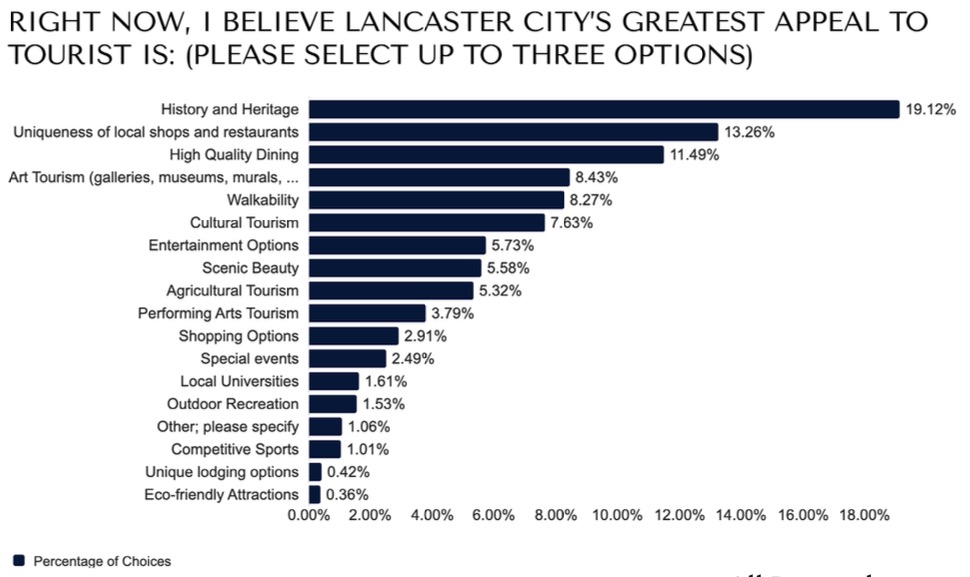
Community Survey – Lancaster City’s Greatest Tourist Appeal
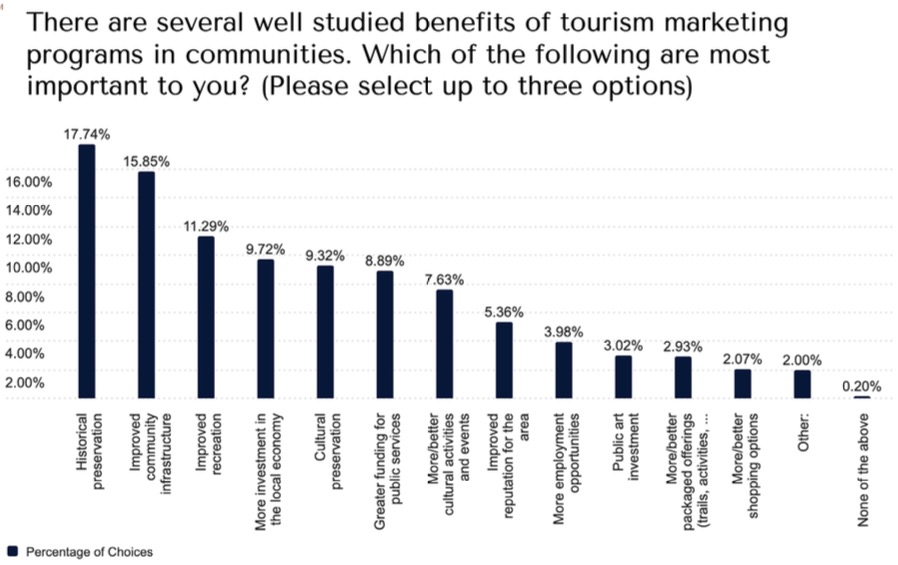
Community Survey – Which tourism benefits are most important to you?
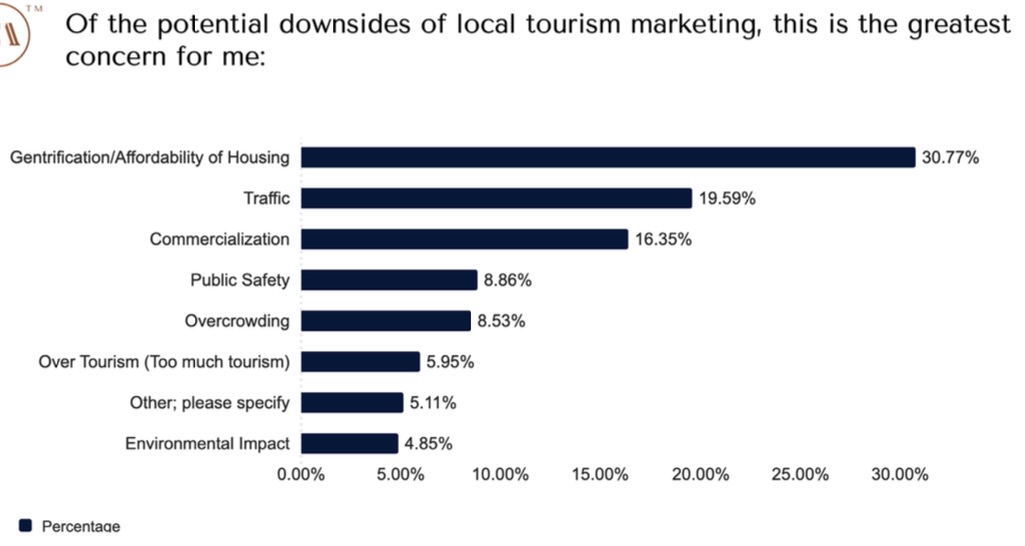
Community Survey – Which potential downsides of tourism is the greatest concern to you?
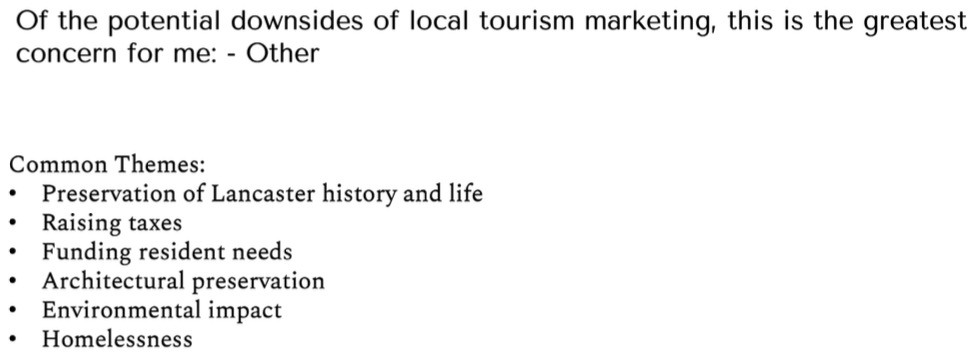
Community Survey – Which potential downsides of tourism is the greatest concern to you? (“Other” Answers)
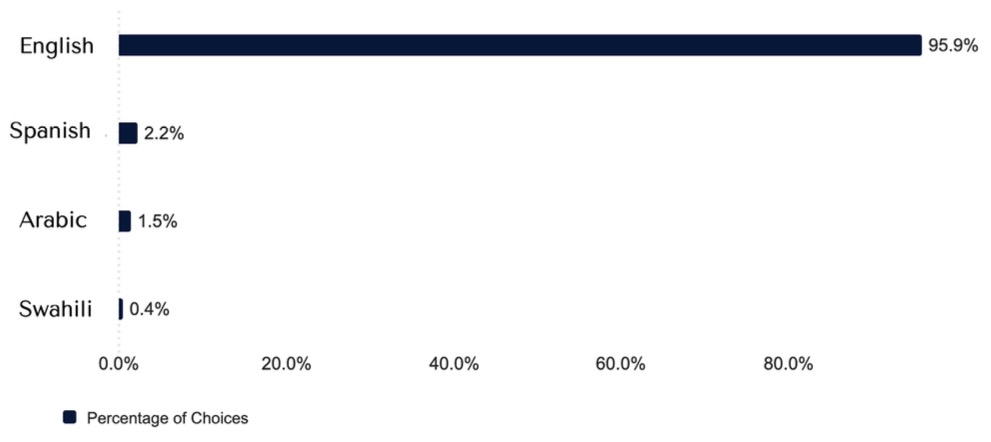
Community Survey – Survey Language
Validation Process and Key Findings
Two 90-minute public validation workshops were held in the summer of 2024. These sessions provided crucial feedback to validate survey data and verify researcher interpretation. Both sessions were open to the public and heavily promoted. One session was hosted at The Mix community center and one at Millersville University’s Ware Center for Performing Arts. At each, researchers observed residents’ strong desire for:
Strong Community Alignment on Identity
Participants saw:
- The city as diverse, independent, creative, artistic, historic, charming, and welcoming
- An opportunity for city-centric tourism promotion to better reflect these characteristics
- Clear differentiation between the city and the county’s identity
Community Development Priorities
Participants expressed a desire for:
- Enhanced city-centric promotional efforts
- Additional connectivity/support mechanisms for small, independent business
- More balanced regional storytelling, “beyond Amish culture”
- Expanded local evening activities, programming, and entertainment options
- Focus on equitable economic development across all city quadrants
Community Concerns
Participants expressed concerns around:
- Housing affordability and accessibility
- Traffic and parking management
- Homelessness and social services
- Business hour consistency
- Infrastructure upgrade needs
Community Focus Groups and Interviews
Several small groups of local residents were invited to participate in additional focus groups to explore key topics including transportation, history, multicultural dynamics, entrepreneurship, and similar. These free-flowing conversations repeatedly led to discussions around a few common and notable topics that seemed to remain top of mind across the community:
Community Identity and Values
- Pride in “Welcoming Culture” tradition
- Appreciation for diversity and multiculturalism
- Desire to support local entrepreneurs
- Concern about over-representation of Amish narrative
- Pride in local food quality and diversity
- Appreciation for historic architecture
Infrastructure and Accessibility
- Parking concerns/perceptions
- Traffic concerns/perceptions
- The importance of walkability
- Desire for continued investment in bike friendly infrastructure
- Accessibility of attractions
Development and Opportunities
- Excitement about Conestoga River Project
- Excitement about the Thaddeus Stevens and Lydia Hamilton Smith Center
- Desire for more music venues and nighttime entertainment
- Need to distribute tourism benefits throughout the city
- Specific interest in developing the visitor economy in the Southeast quadrant
- Drive to increase Queen Street corridor foot traffic
Community Concerns and Communications
- Respectful discussion of complex issues (homelessness, housing costs, etc.)
- Desire to correct misperceptions about safety, parking, and accessibility
- Interest in city-centric storytelling and promotion
- Recognition of different visitor preferences for city vs. county
- Prioritization of small/independent local businesses
Business Community Priorities and Perspectives
Through focused polling and discussion workshops, business owners provided significant feedback and articulated several priority concerns.
Overall, local business owners were proud to call the City of Lancaster home. They described the community as “vibrant,” “diverse,” “unique,” and “friendly.”
When asked about vision and aspirations, respondents expressed a desire to prioritize authenticity, to support one another, to improve infrastructure, and to increase inclusion, especially with segments of the population that may not have historically had equitable access to prosperity. Business owners also echoed the broader resident feedback with a strong desire to continue nurturing the city as a “welcoming location” that is also a nice place for people to live.”
Local business stakeholders believe that the diversity of Lancaster City was its greatest strength. They also noted the variety and diversity of businesses, residential enthusiasm, local passion and entrepreneurship, and walkability of the area were key strengths that could be further capitalized on through this planning process.
However, business owners named several significant concerns including homelessness, affordability, current city communications and marketing, and downtown parking accessibility which they perceived as current weaknesses. They also noted several potential threats including gentrification, visitor safety concerns (even if these concerns were more about perception or reputation rather than confirmed crime or safety incidents), over-expansion at the expense of historic architecture preservation, chain- or franchise-based retail, and increasing costs and inflation. They indicated that they hoped these threats could be proactively managed.
Business owners were proud of Lancaster City but believed that the business community could be further supported by investing in the creation of a city-specific tourism marketing and promotion function. Business owners expressed that they most often receive support from the city with marketing, advertising, promotions, networking and event planning support. However, when asked their level of satisfaction with the support received, only 34.62% of respondents reported that they were currently satisfied.
When asked about opportunities for Lancaster City to support its local businesses, respondents expressed interest in having more marketing, advertising, and promotion support, as well as access to additional financial assistance or grants, and professional development opportunities for both management and front-line workers.
The business stakeholders polled expressed interest and enthusiasm around the idea of attending city-sponsored trainings, business support, and professional development programs in order to improve business operations, efficiency and industry performance citywide.
Similarly, in order to improve local promotions for the city and its businesses, the majority of respondents indicated that they may be willing, or would be willing, to contribute to a local promotions fund (26% indicating “yes” and 61% indicating “maybe”).
Pennsylvania allows for Tourism Business Improvement Districts (TBIDS) which work in a similar fashion to the Downtown Investment District (DID) program. Operators in a specific area can self-select to authorize a TBID which would then trigger a localized collection of funds to support a tourism marketing programs supporting that same designated area.
However, because of the overlapping footprint of Lancaster City’s Downtown Core and the current DID program, as well as the location of the businesses most likely to be interested in pursuing a TBID program, implementing a TBID as originally envisioned by the state could be challenging.
One potential solution that could be further explored would be a direct allocation of a set percentage of DID funding that could get automatically allocated to a tourism marketing fund each year.
Business Community Goals
Enhanced Marketing Support
- Desire for coordinated citywide promotion
- Request for more tools and training to help individual businesses market more effectively
- Collaborative promotional opportunities
Professional Development
- Management training programs
- Front-line worker skill development
- Industry-specific education
Financial Resources
- Grant program accessibility
- Investment opportunity awareness
- Development of more funding mechanisms for small and independent local businesses
District Coordination
- Hours standardization support
- Event planning alignment
- Seasonal strategy development
Infrastructure Improvements
- Enhanced parking solutions that reduce perceived barriers to access
- Streetscape enhancements
- Refreshed signage and wayfinding
Recommendations for Lancaster City Retail Districts:
- Establish core business hours for each district
- Communicate changes widely and well in advance
- Consider seasonal district planning
- Coordinate special events with corresponding hours
- Create and promote standardized district wide holiday schedules
- Maintain accurate and up to date hours across all platforms
- Emphasize and enhance digital fluency and marketing expertise
Business Owner Perspectives and Priorities
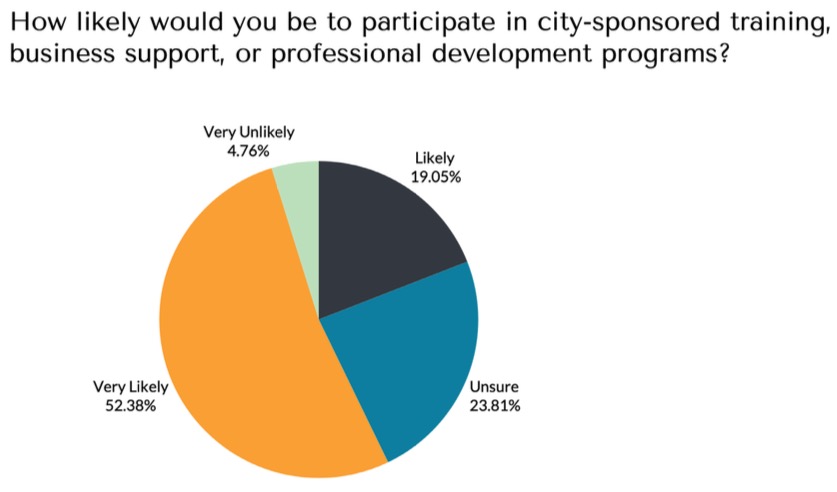
Business Owner Survey – Likelihood of support for City-sponsored training, business support, or professional development programs.
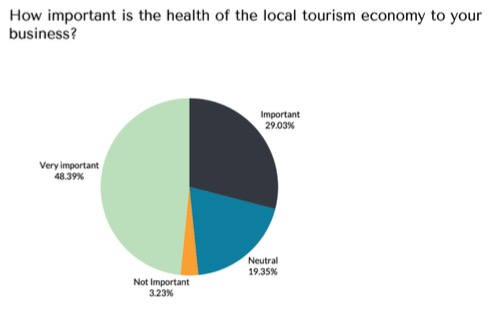
Business Owner Survey – How important is the health of the local tourism economy to your business?
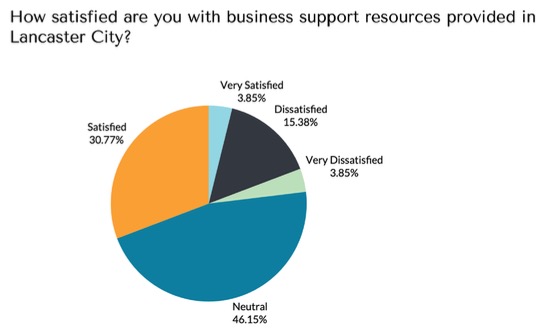
Business Owner Survey – How satisfied are you with business support services provided in Lancaster City?
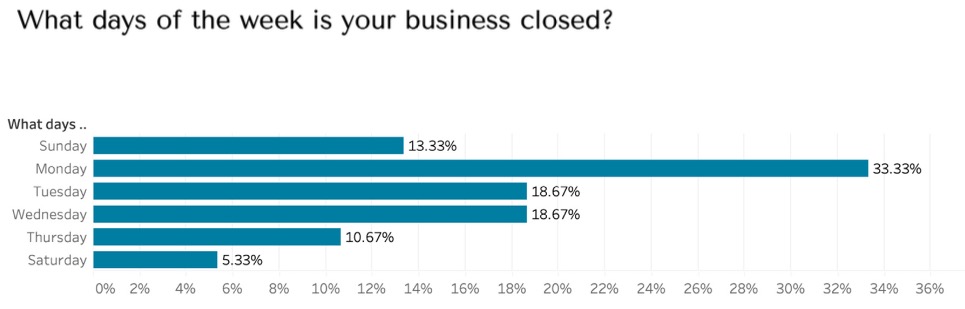
Business Owner Survey – What days of the week is your business closed?
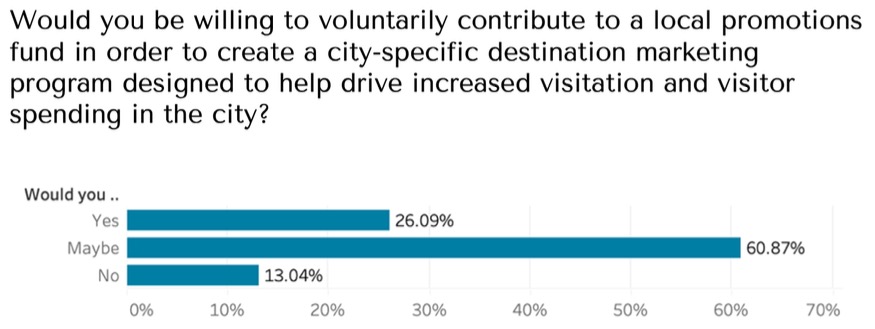
Business Owner Survey – Would you be willing to voluntarily contribute to a local promotions fund in order to create a city-specific destination marketing program designed to help drive increased visitation and visitor spending in the city?
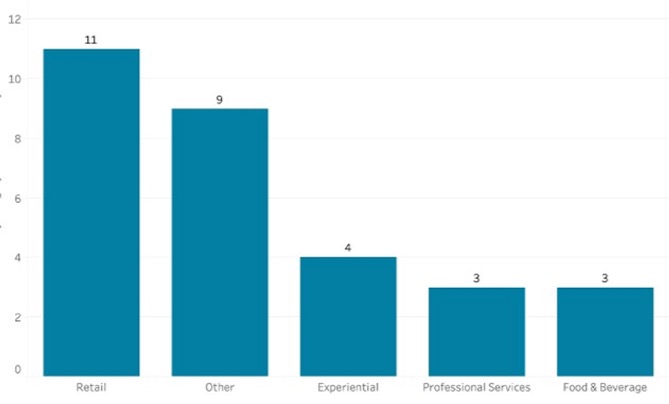
Business Owner Survey – Industry Breakdown
Lancaster City Visitor Analysis
Key Metrics:
- 141,710 unique visitors to Lancaster City
- Visitor types:
- 42% day visitors
- 70% overnight visitors
Note: These categories overlap due to repeat visitors making different trip types
Visitation Patterns:
- Average day trip duration: 7.96 hours (median: 6.87 hours)
- Average overnight stay: 1.69 days (median: 1.03 days)
- Return visitation: 49.5% made multiple trips
- First-time visitors: 50.6% single trip visitors during the study period
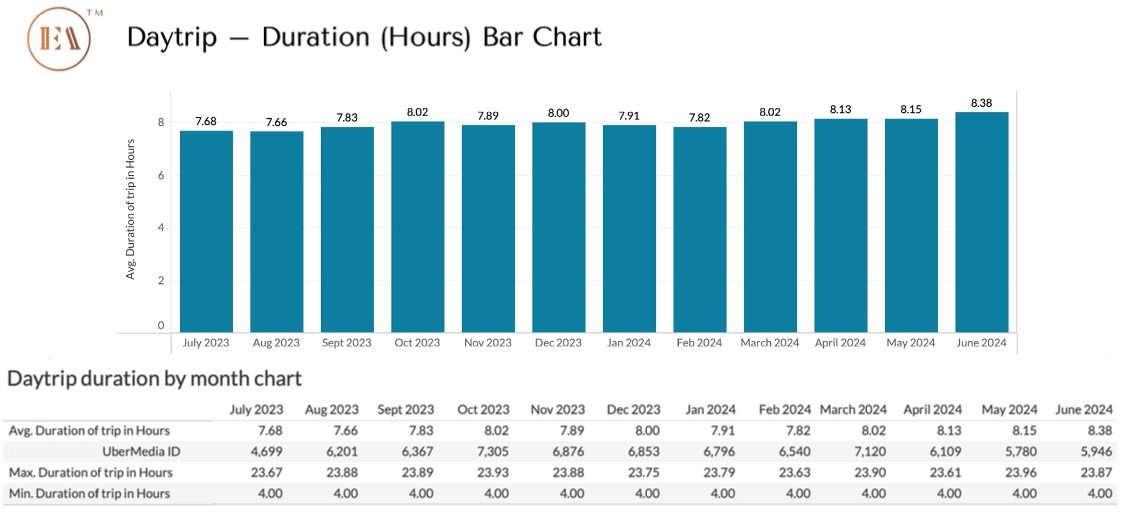
Daytrip Duration (Hours)
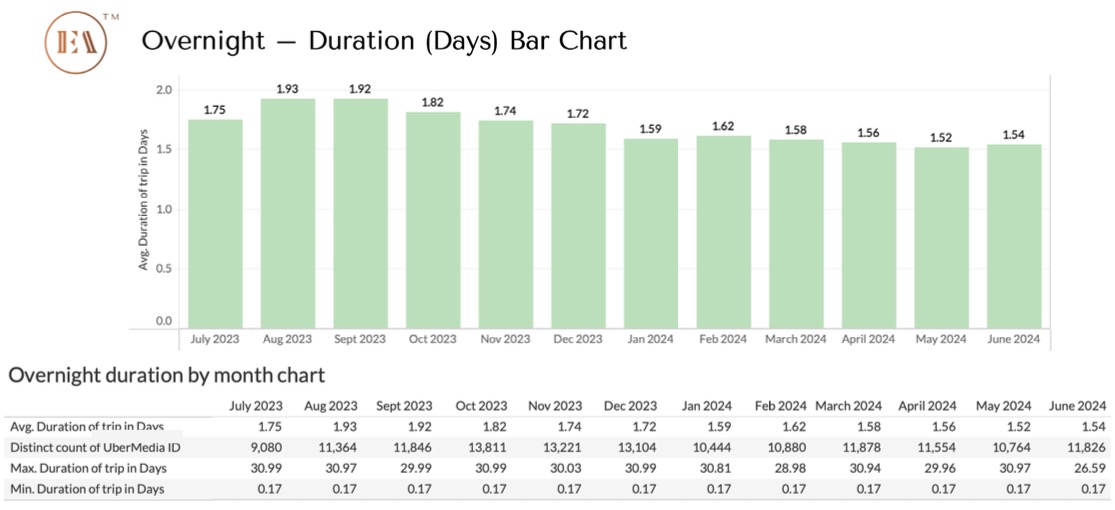
Overnight Trip Duration (Days)
Geographic Origins
Top State Level Feeder Markets:
- Pennsylvania: 38.47%
- New York: 16.79%
- Washington, D.C.: 8.00%
- Maryland: 5.72%
- Florida: 3.51%
Top Metro Feeder Markets:
- Philadelphia, PA (22.85%)
- New York, NY (14.07%)
- Washington, D.C. (8.00%)
- Wilkes Barre-Scranton, PA (7.17%)
- Pittsburgh, PA (3.74%)
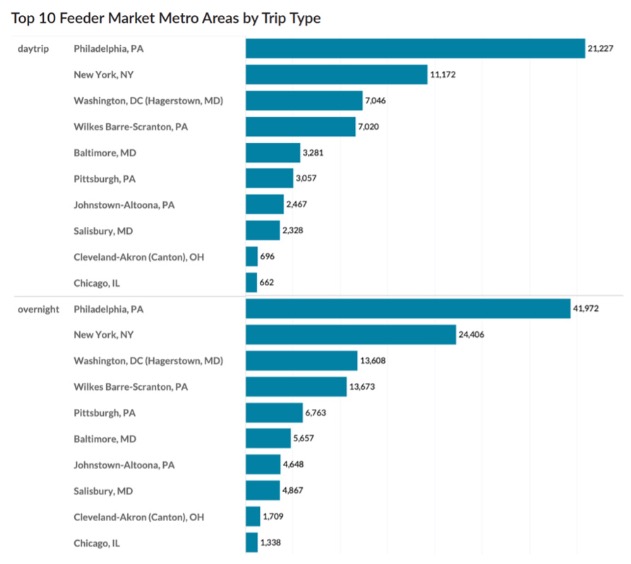
Top 10 Feeder Market Metro Areas by Trip Type
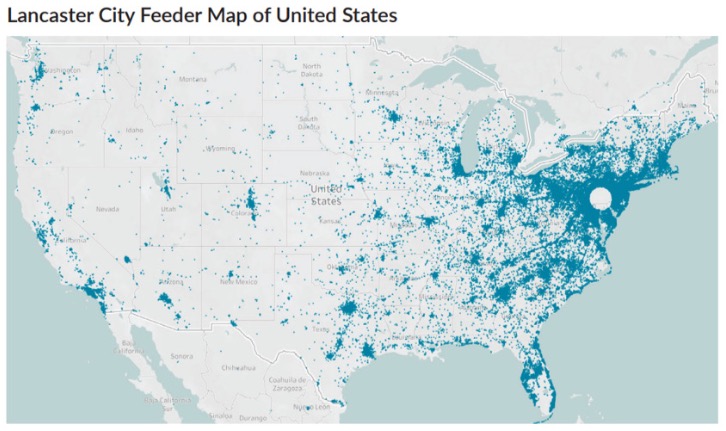
Lancaster City Feeder Map of United States
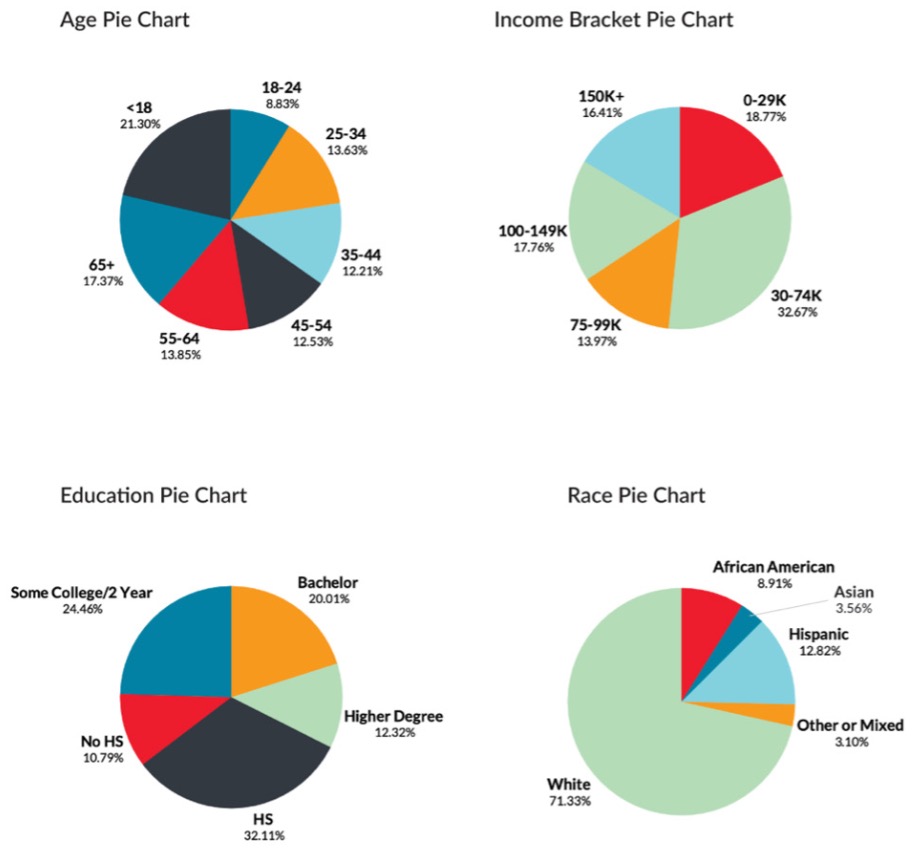
Graphs of Visitor Demographics by Age, Income Bracket, Education, and Race
City Visitor Demographic Profile
Age Distribution
- Remarkably even spread across age groups
- 8-17% representation per decade from 18-65+
- Slight skew toward 25-54 age range
Education & Income
- 32.33% hold higher education degrees:
- 20.01% bachelor’s degree
- 12.32% advanced degree
Median Household Income
- $79,377
Average Home Value
- $247,154
Ethnic Diversity
- 71.33% White
- 12.82% Hispanic
- 8.91% African American
- 3.56% Asian
- 3.1% Other/Mixed ethnicity
City vs. County Comparison
To further analyze this information in context, researchers also studied visitors who stayed in Lancaster County for more than four hours and resided outside a 50-mile radius during this same time-period. This provided an opportunity to compare-and contrast visitor profiles accordingly.
The research revealed some similarities and some distinctions between the two destinations and highlighted several significant opportunities for further market and destination development in the City of Lancaster.
Visitor Volume:
- County: 709,810 visitors
- City: 141,710 visitors
- 11.3% of the county’s 700,000+ captured visitors (80,198) spent 4+ hrs in city during their trip(s)
Demographic Variations:
Income Levels:
- Visitors to the county had an average household income of approximately $3,000 more per year than the city
- City visitors: $79,377 median household income
- County visitors: $82,553 median household income
Education:
- Visitors to both the city and county had similar educational backgrounds
- City: 32.33% college educated
- County: 32.70% college educated
Ethnic Composition:
- Higher Hispanic visitation in city (12.82% city vs 10.59% county)
- Lower White/Caucasian visitation in city (71.33% city vs 73% county)
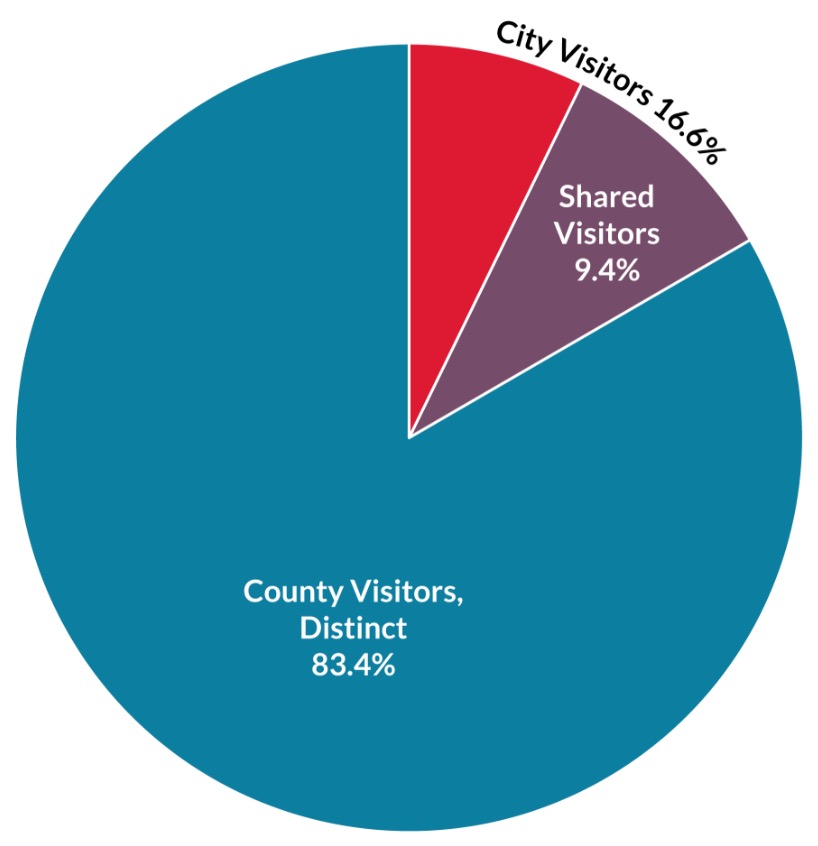
Only 11% of Lancaster County Visitors also spent 4 or more hours in the City of Lancaster.
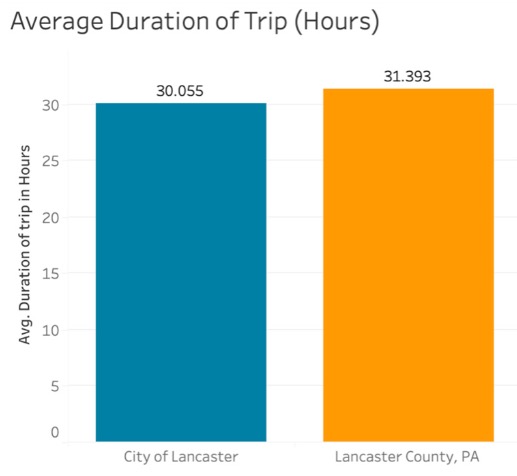
Average Trip Duration (Hours) for Lancaster City and Lancaster County
Top Feeder Markets
A “feeder market” refers to a geographical location or demographic group that provides a significant number of customers to a larger, more central market. Essentially, it’s a source of business for a specific business or industry. In tourism, feeder markets are usually specific regions that travel to a given destination with more frequency than other locations. Identifying these markets allows the city and its businesses to tailor their marketing and sales strategies to leverage these trends to reach and attract the most relevant visitors with the greatest probability of conversion or visitation.
*grid*
Visitor Survey Insights
In addition to studying visitor movement patterns and demographic make-up using quantitative data, researchers conducted a six-week visitor survey to gather and analyze qualitative impressions. The survey was open to travelers across the country that self reported that they visit Mid-Atlantic destinations and included participants familiar with Lancaster City whether or not they had visited previously.
The survey received 231 responses and 151 completed surveys. Data from partial survey feedback was included in question analysis.
The survey ran from the beginning of October to the middle of November 2024, and it provided additional insights into visitor preferences and behaviors:
Visitor Survey Participant Demographics:
- Gender: 63.82% female, 34.67% male, 1.51% other/prefer not to say
- Age: Majority 25-54, with strong 65+
- Household: 87.69% multi-person
- 87.77% of participants had visited the county at least once
- 85.71% of visitors had visited the city at least once
Traveler Familiarity and Brand Awareness
The majority of respondents said they were either “very familiar” or “somewhat familiar” with Lancaster City. However, these figures were lower than those that measured broader awareness of Lancaster, PA more generally.
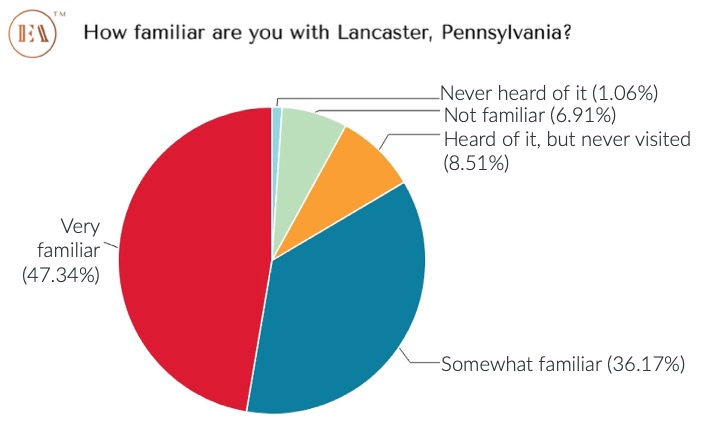
Survey Result – How familiar are you with Lancaster, Pennsylvania?
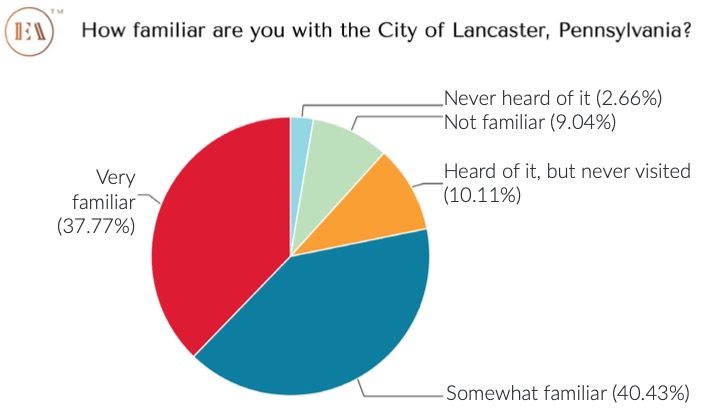
Survey Result – How familiar are you with the City of Lancaster, Pennsylvania?
Trip Duration:
- 52.04% typically stay 1-3 days
- 34.18% typically stay 4-6 days
- 11.22% typically stay 7-10 days
Travel Companions:
- Most frequent: spouse/partner
- Secondary: friends (82%) and/or school aged children (24%)
Transportation:
- 94.90% arrive by car
- 30.61% use air travel
- 16.33% arrive by train
Accommodation Preferences:
- 66.67% prefer chain hotels
- 52.91% use vacation rentals
- Notable overlap indicating situation-based choices and limited competition
Travel Motivations:
- Relaxation
- Culture and history
- Visiting friends/family
Activity Preferences:
- 73.68% seek scenic views/nature
- 71.05% visit local markets/shops
- 68.95% prioritize food/culinary experiences
Destination Selection Factors:
- Cost and affordability
- Available attractions
- Safety and cleanliness
Traveler Perceptions:
Public perceptions of Lancaster City reveal that visitors believe the city has great cultural heritage, offers unique culinary experiences, and showcases unique local crafts. Words like “restaurant,” “fun,” “historic,” “cultural,” and “positive” were used most frequently when survey participants were asked to describe current perceptions of the City of Lancaster.
Individuals noted that more events, parking, and entertainment might encourage more visitation to the city.
Visitor Survey Question Highlights
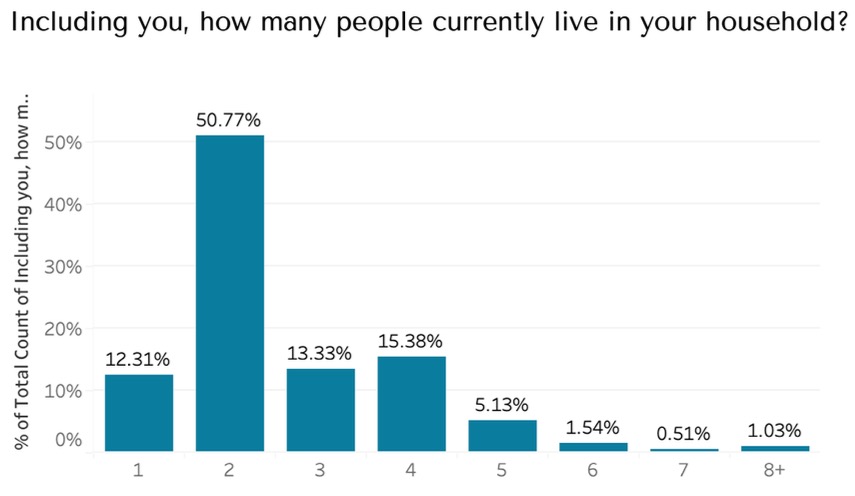
Visitor Survey – How many people currently live in your household?
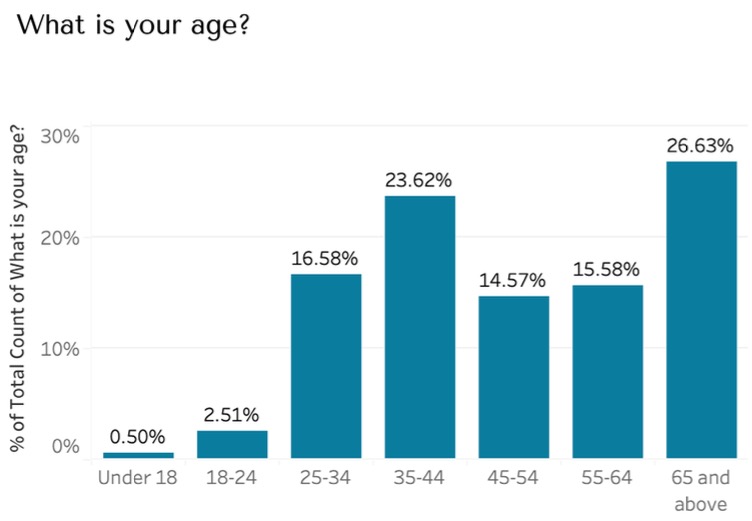
Visitor Survey – What is your age?
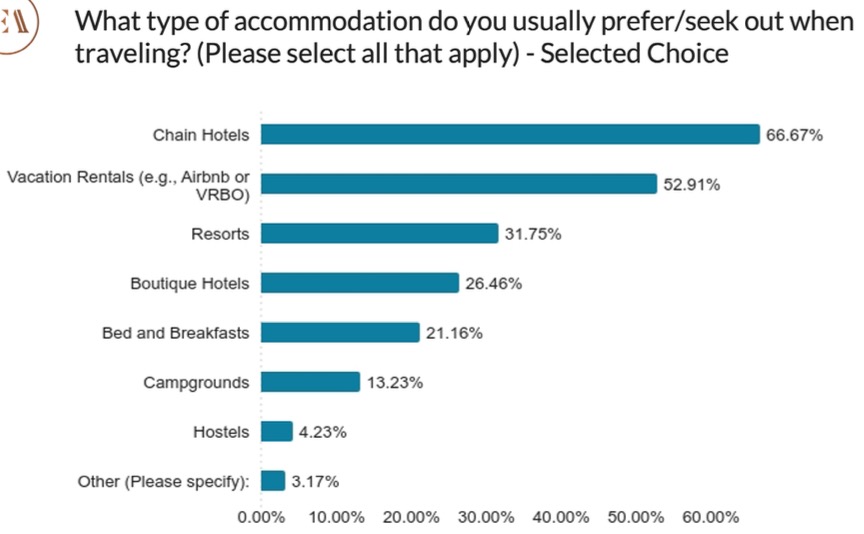
Visitor Survey – What type of accommodation do you usually prefer/seek out when traveling?
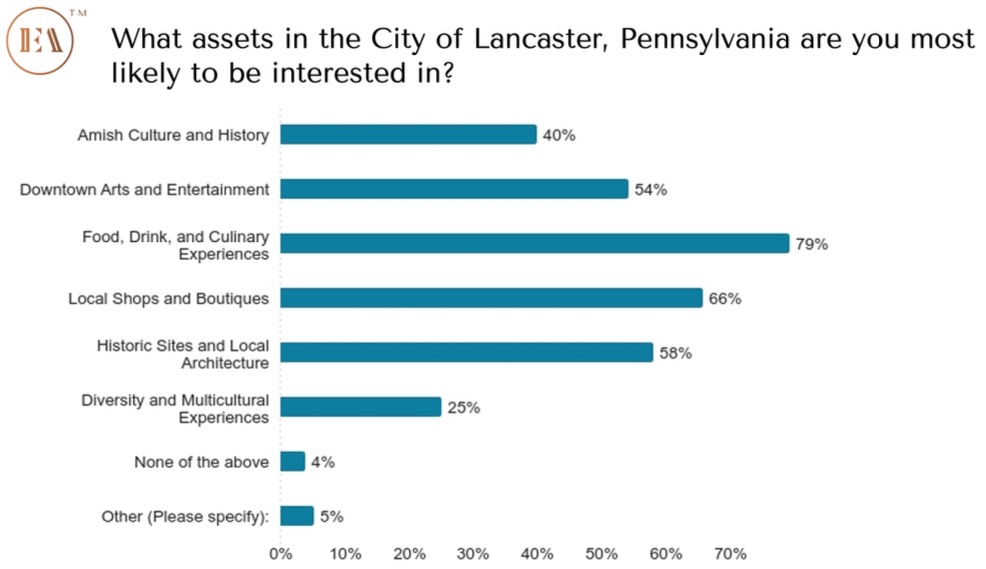
Visitor Survey – What assets in the City of Lancaster, Pennsylvania are you most likely to be interested in?
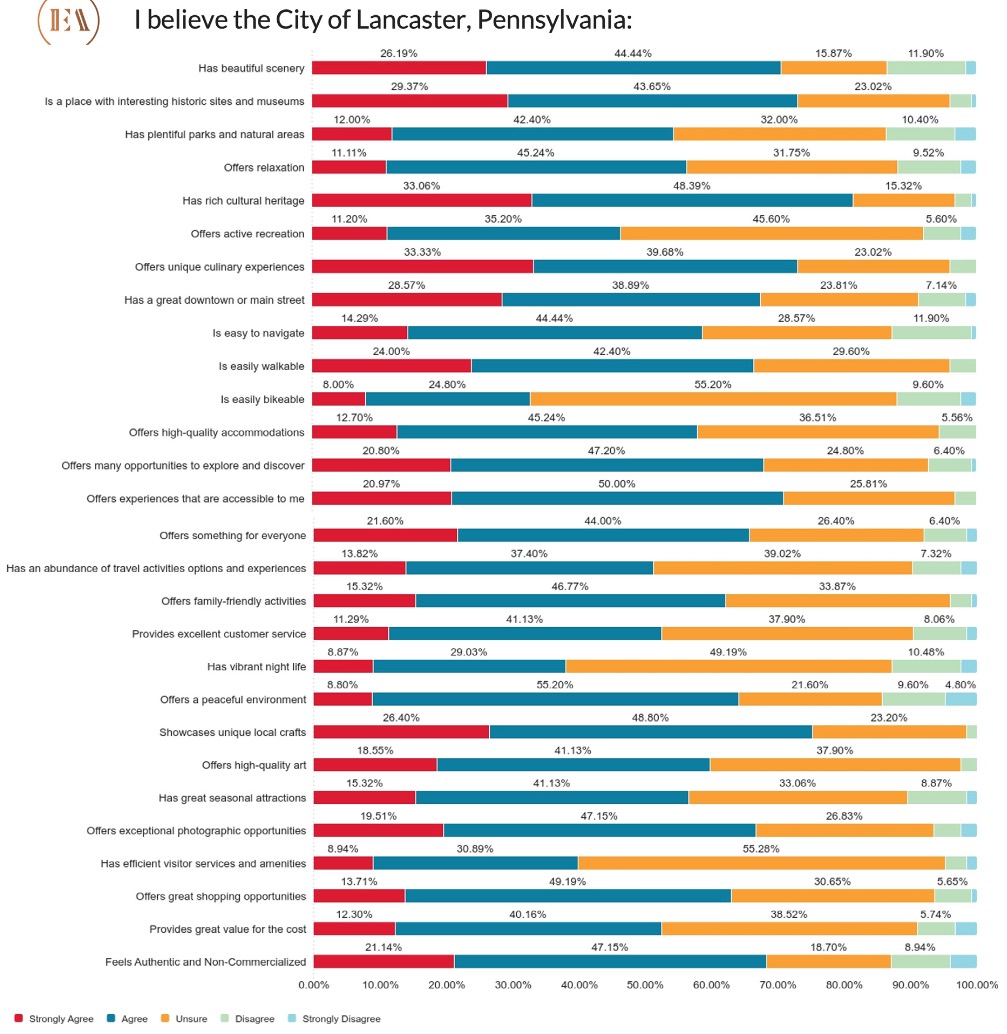
Visitor Survey – I believe the City of Lancaster, Pennsylvania:
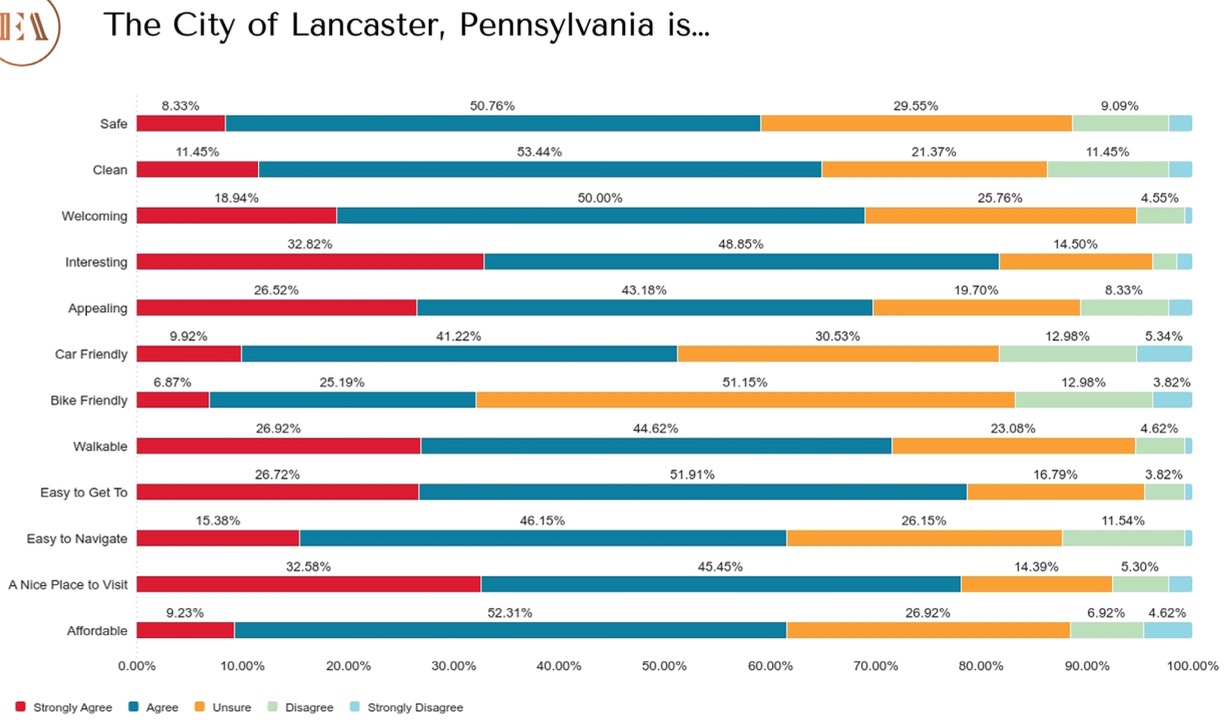
Visitor Survey – The City of Lancaster, Pennsylvania is…
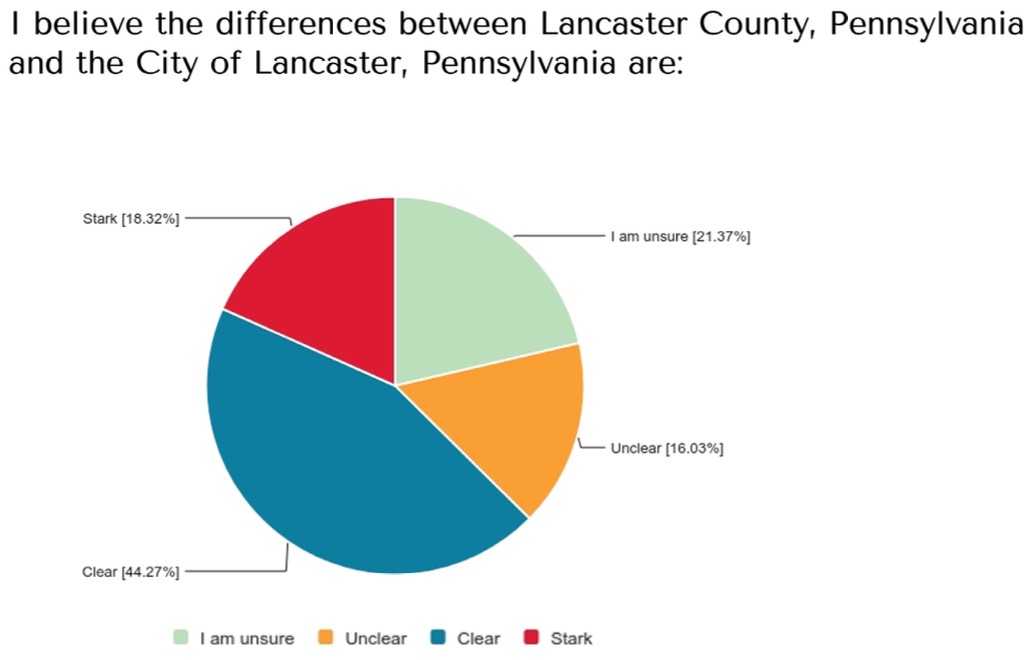
Visitor Survey – I believe the differences between Lancaster County, Pennsylvania and the City of Lancaster, Pennsylvania are:
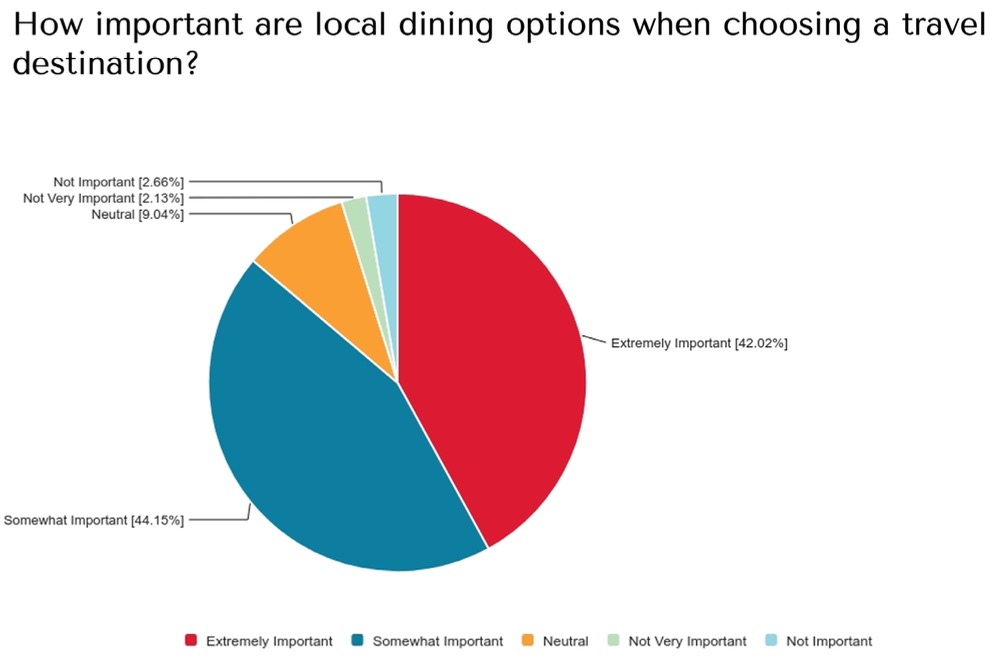
Visitor Survey – How important are local dining options when choosing a travel destination?
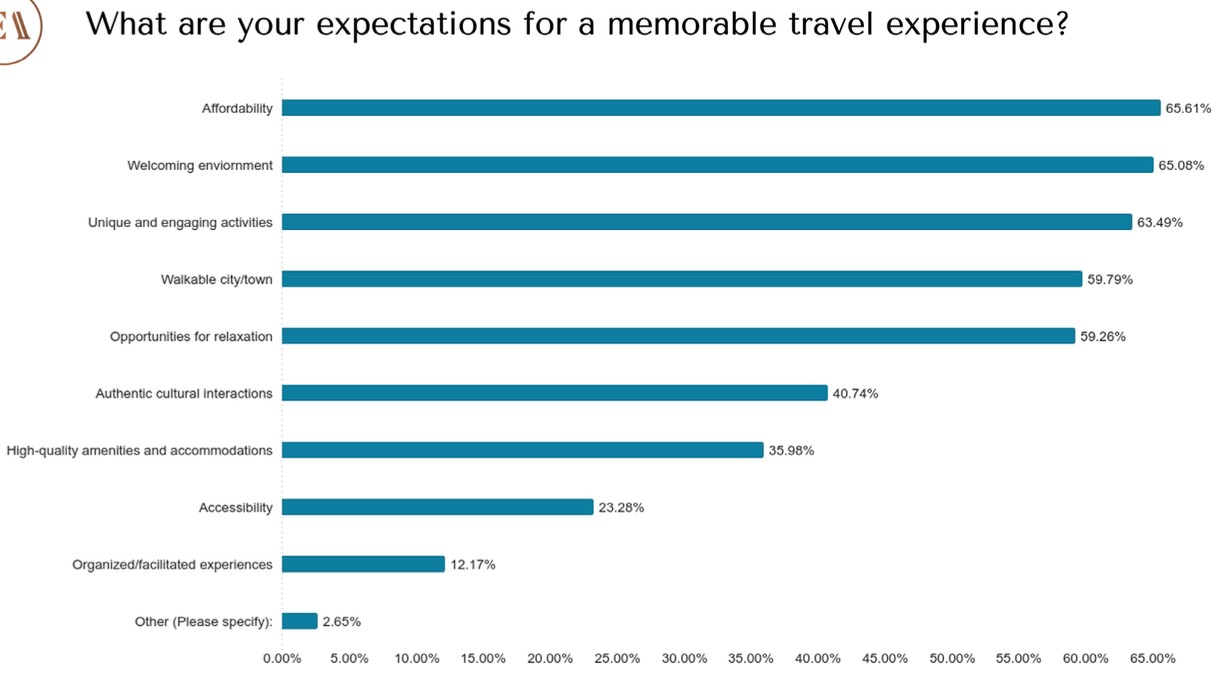
Visitor Survey – What are your expectations for a memorable travel experience?
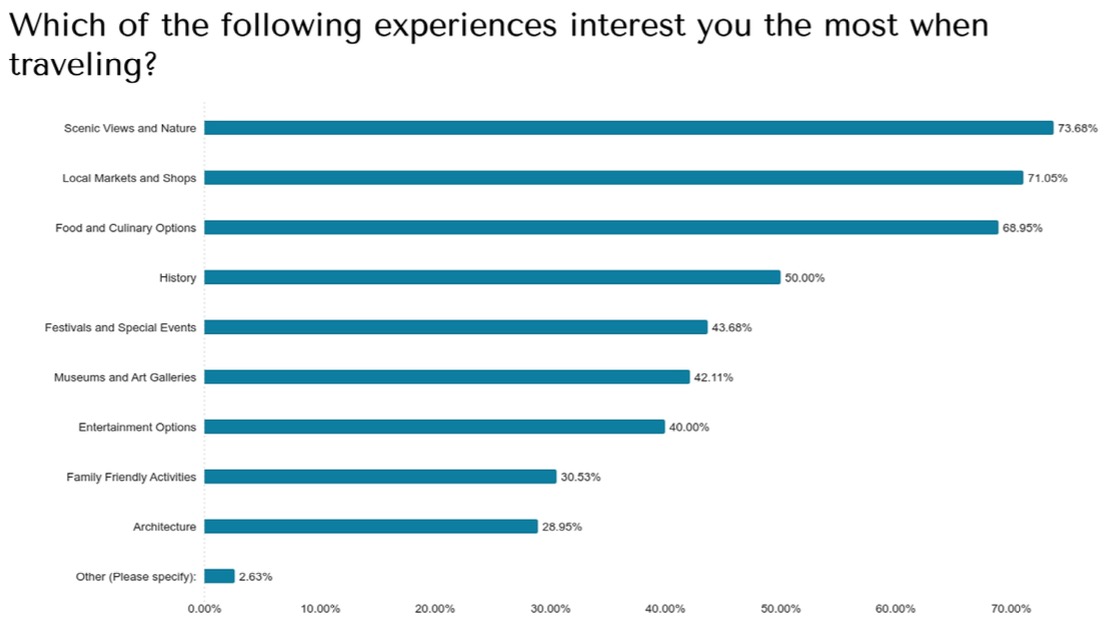
Visitor Survey – Which of the following experiences interest you the most when traveling?
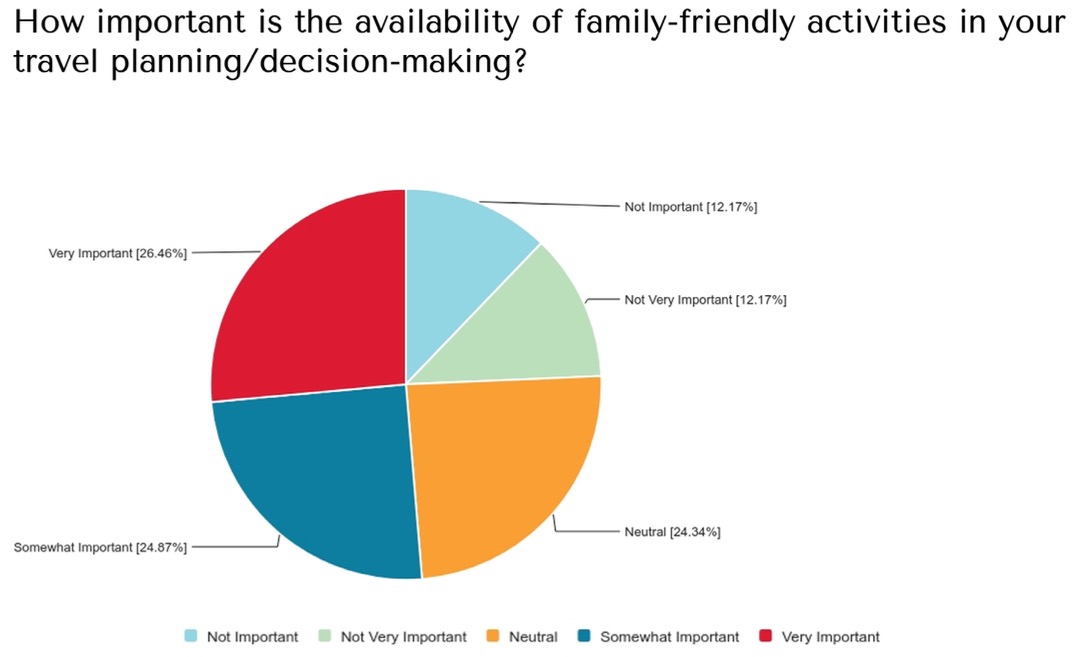
Visitor Survey – How important is the availability of family-friendly activities in your travel planning/decision-making?
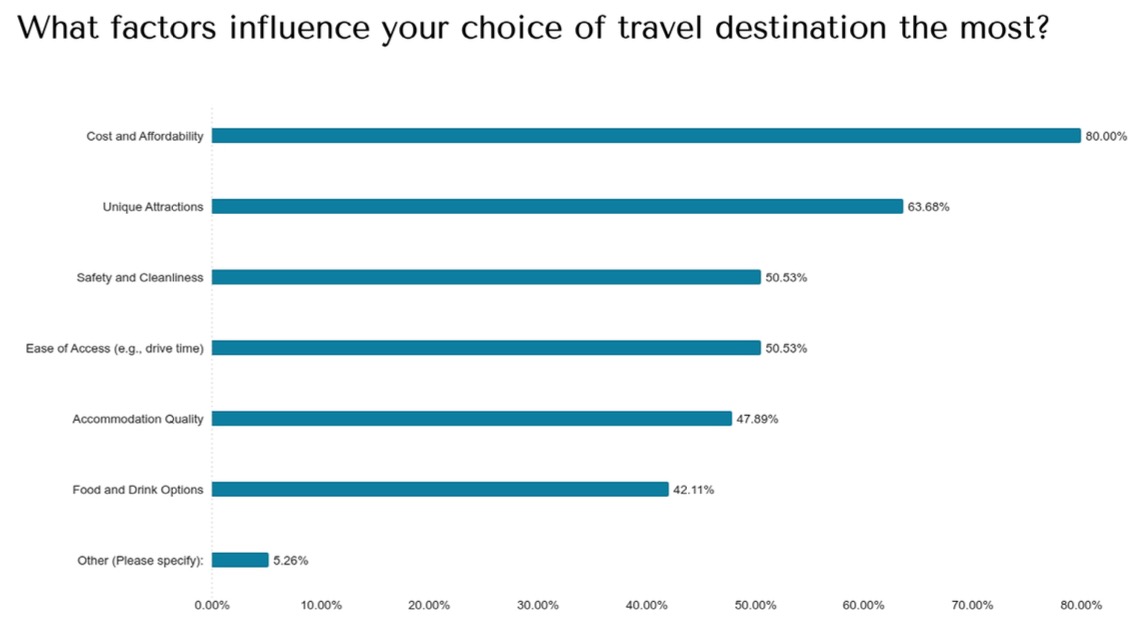
Visitor Survey – What factors influence your choice of travel destination the most?
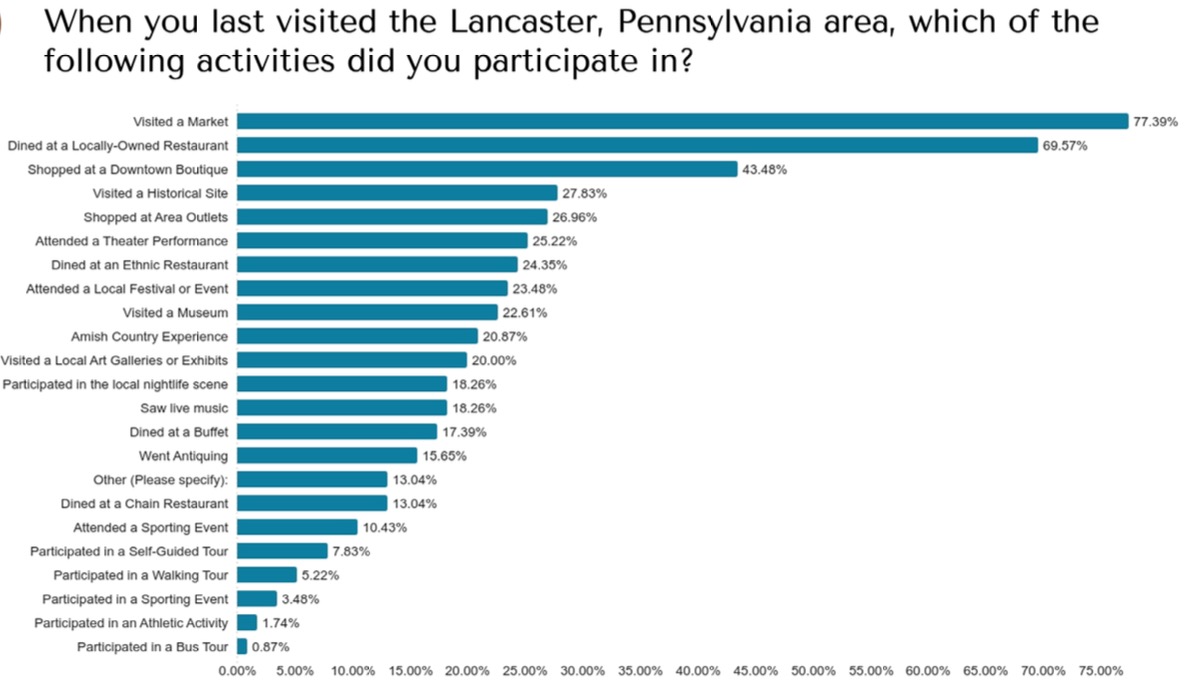
Visitor Survey – When you last visited the Lancaster, Pennsylvania area, which of the following activities did you participate in?
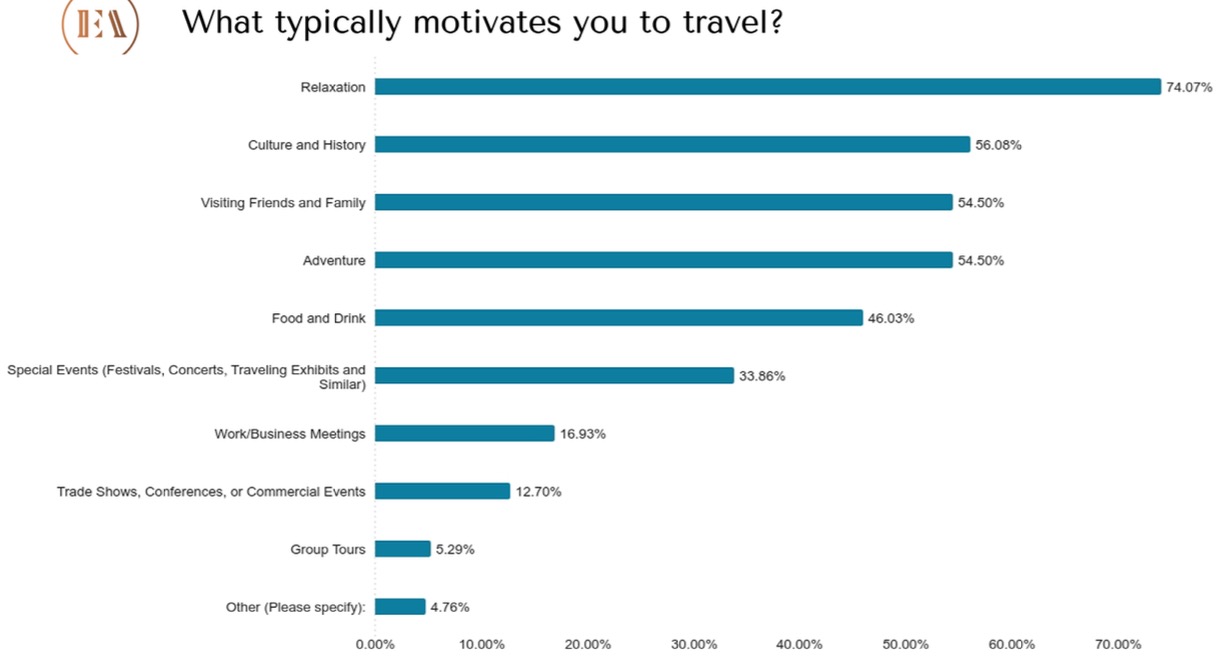
Visitor Survey – What typically motivates you to travel?
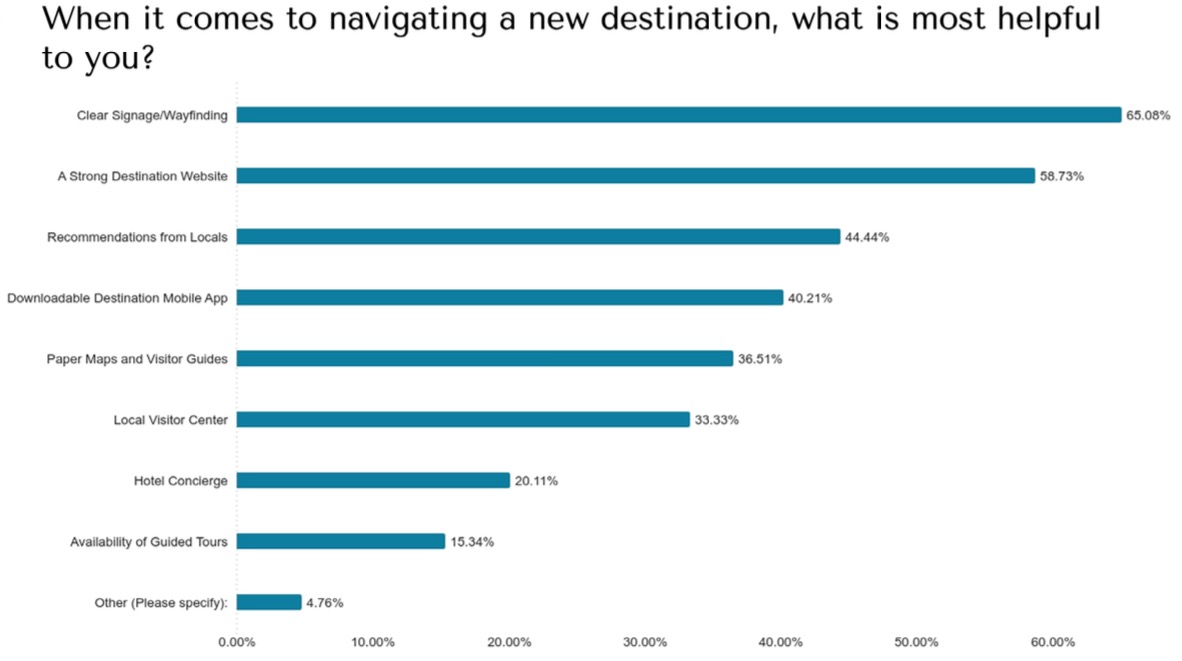
Visitor Survey – When it comes to navigating a new destination, what is most helpful to you?